To create and grow a successful company or startup, there are several essential marketing steps to follow.
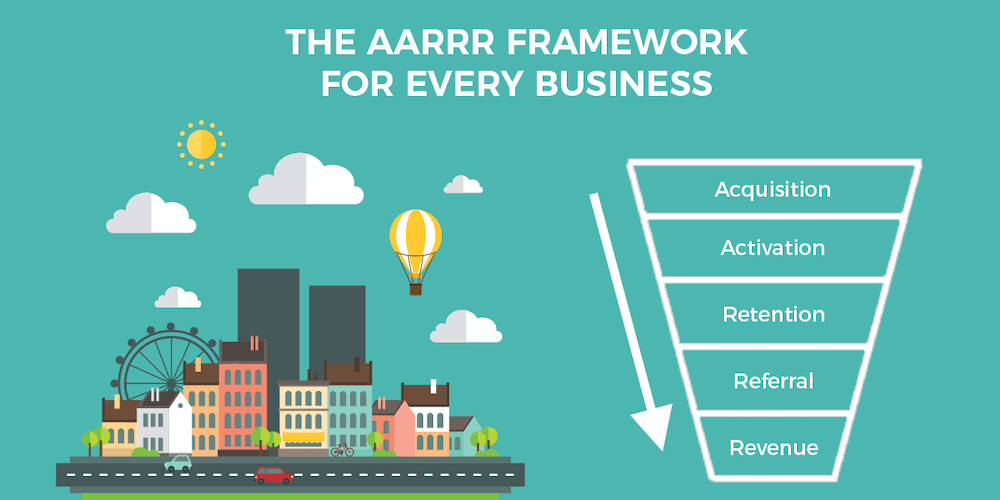
One tool that can help is in that process is the AARRR framework that takes a close look at the customer’s journey through 5 key steps: Acquisition, Activation, Retention, Referral, and Revenue – hence the famous acronym.
We will see in this post the advantages of this framework for a business’ growth strategy and how we can use it for Growth Hacking.
The origins of the AARRR Framework
The AARRR method can be compared to a model that identifies a client’s life cycle.
It is also referred to as an “acquisition funnel” that helps obtain a clear and complete analysis of the target market.
Entrepreneurs have every reason to make use of such a framework when drawing up their business plans.
The AARRR method was first used in 2007 by American entrepreneur Dave McClure at a conference called “Startup Metrics for Pirates: AARRR!“.
By then, he had already contributed to the creation of at least 500 startups and wanted to illustrate the type of business strategy he was using with elements already well known in traditional marketing.
Thanks to his valuable experience as a startup founder, Dave McClure managed to identify 5 essential points that every entrepreneur who wants to grow fast should know and focus on.
These 5 points combined offer the perfect framework for a viable economic model, allowing young companies to grow fast.
What does AARRR mean ?
A for Acquisition
The first step is to attract new users and allow them to discover a product or service. During the reflection process, it is necessary to perceive the customer as a potential buyer.
At this stage, several tools are available to acquire new customers. For this example, we will focus on SEO, which allows us to obtain organic traffic considered “free”. But of course, other tools exist for customer acquisition, such as buying ads on search engines with SEA, social media ads, email marketing, etc..
To evaluate the results of traffic acquisition campaigns, a number of performance indicators – or KPIs for Key Performance Indicator – should be tracked. They include the following:
- Volume indicators: these refer to the number of visitors or unique visitors who visit a website. To be successful, you need to focus on channels that bring the most new users. One channel may be more effective than another, so it may seem relevant to compare the number of new users generated by each channel.
- Performance or engagement metrics: these include the bounce rate, the number of page views per site, or the average time spent on the site. We tend to choose the most efficient channels according to users’ activity to obtain more qualified visits.
- Conversion and profitability indicators: these indicators make it possible to determine more precisely the cost spent to acquire a user and the return on investment per channel. Of course, you should focus on channels with a positive ROI.
A for Activation
This step consists in transforming website visitors into users or prospects. It is during this phase that it becomes possible to measure user engagement and conversion rates.
Several KPIs exist and allow you to evaluate the activation stage for each user, ranging from interest to desire:
- Interest-related performance indicators: for example, you can use retention rates or “loyalty rates”, metrics that make it possible to measure the profitability of diverse acquisition efforts over the mid and long term.
- Desire-related performance indicators: these can be the rate of use of a feature or newsletter subscription rates, for example.
R for Retention
This step refers to the ability to retain users, ideally by turning them into active users. Retention is regularly associated with reactivation through processes such as targeted emailing and the publication of “targeted” posts.
KPI indicators for retention can be the number of days since the last visit or activity or the number of visits per month.
R for Referral
This step consists of empowering the most active users by encouraging them to be ambassadors for your service or product. Through this type of campaign, we hope to generate highly qualified traffic in the long term.
Among the existing KPIs for referrals, we can mention the virality (number of social shares per user). The number of active referrals per user is another indicator to measure.
R for Revenue
Monetization ensures the economic viability of a business. This is why it seems essential to transforming a unique visit from a user into a customer, subscriber, or lead.
However, many startups move to this stage too early, impacting the previous phases negatively. So be thoughtful about this stage.
Among the KPIs to be retained in this case, you can use the conversion rate of users into customers as well as the average revenue per customer.
Using the AARRR framework to your advantage
The AARRR method, through successive steps, unlocks key performance indicators, which are as many levers to develop the growth of a project.
However, each of these indicators or KPIs must be used wisely and strategically, depending on the nature of the business in question.
The optimization of these different indicators can be at the core of a long-term relationship with a web marketing agency specialized in traffic acquisition.
The value of the AARRR method is to be as much theoretical as it is practical.
In the first case, it provides a schematic representation of the different steps to follow to better understand a startup’s functioning.
In the second case, the AARRR framework gives you the structure to learn how to build and manage a certain number of indicators and essential “metrics” for a growth hacking strategy.